Muons in cosmic ray showers are the best handle we have to determine the mass of the primary cosmic rays. Well… they would be if the simulations agreed with data! If our simulations were correct, we could use the knowledge derived from them. We could determine the energy and mass of a primary cosmic ray if we simultaneously measure the electrons and the muons in the resulting cosmic ray shower. This can be seen in this figure produced from simulations:
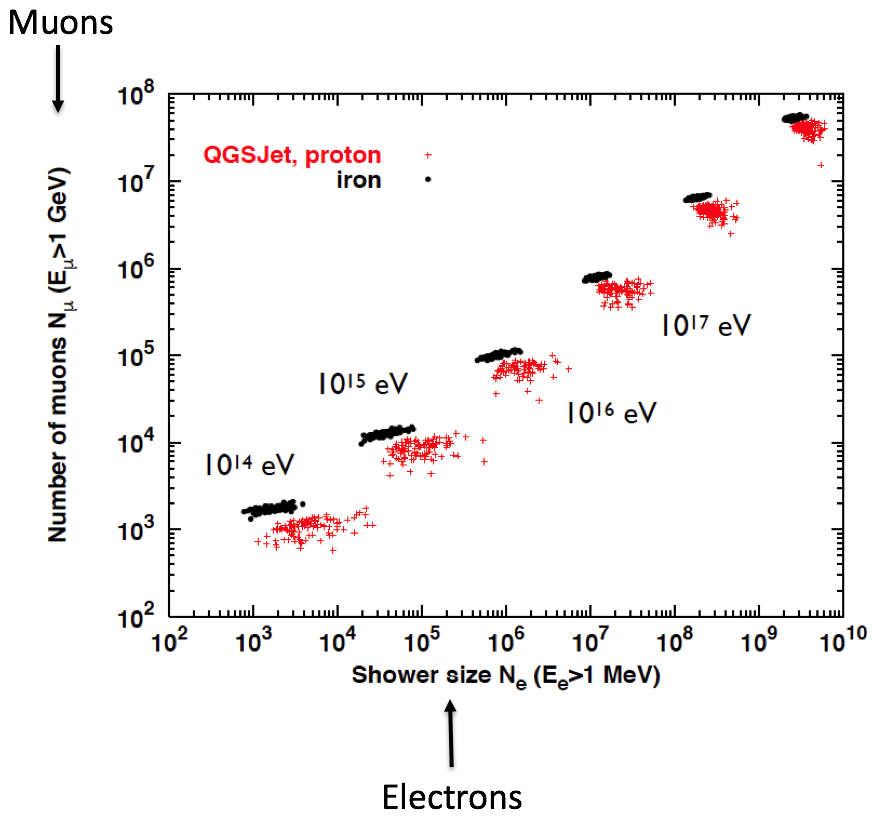
Unfortunately, simulated air showers do not produce the same number of muons as the real ones. The difference between simulations and data can not be explained with heavier or lighter primary cosmic rays. Discussing this would have to be done in another article. To know more, check Viewpoint: Cosmic-Ray Showers Reveal Muon Mystery.
The Analysis
I have measured the number of muons in air showers using the data from the IceCube Neutrino Observatory. This is one of the main results currently used to validate and develop the simulations of cosmic ray interactions in the atmosphere. A proceeding for the first version of this analysis can be found in arXiv:1501.03415. The analysis code lives in a private repository.
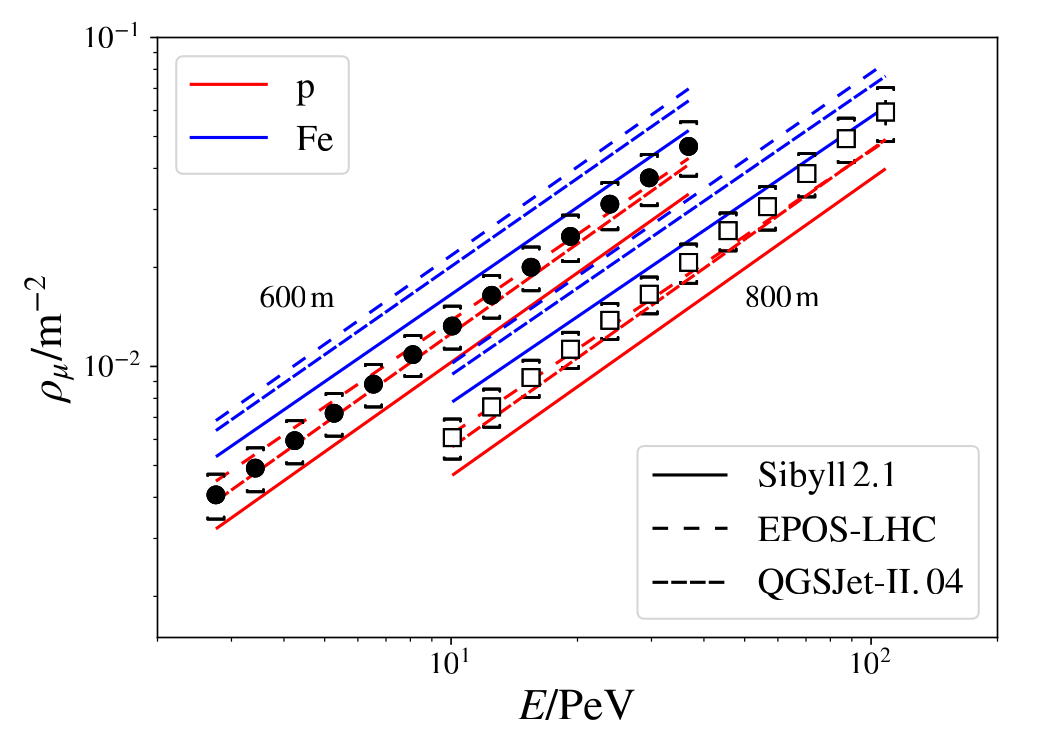
The number of muons is determined from aggregate data taken over three years. The entire dataset, after filtering and processing, takes a bit more than 1 TB. From this data we get a set of histograms of the signals measured in the detector, binned by cosmic ray energy and arrival direction, which are then compared against a predictive model to infer the muon number.
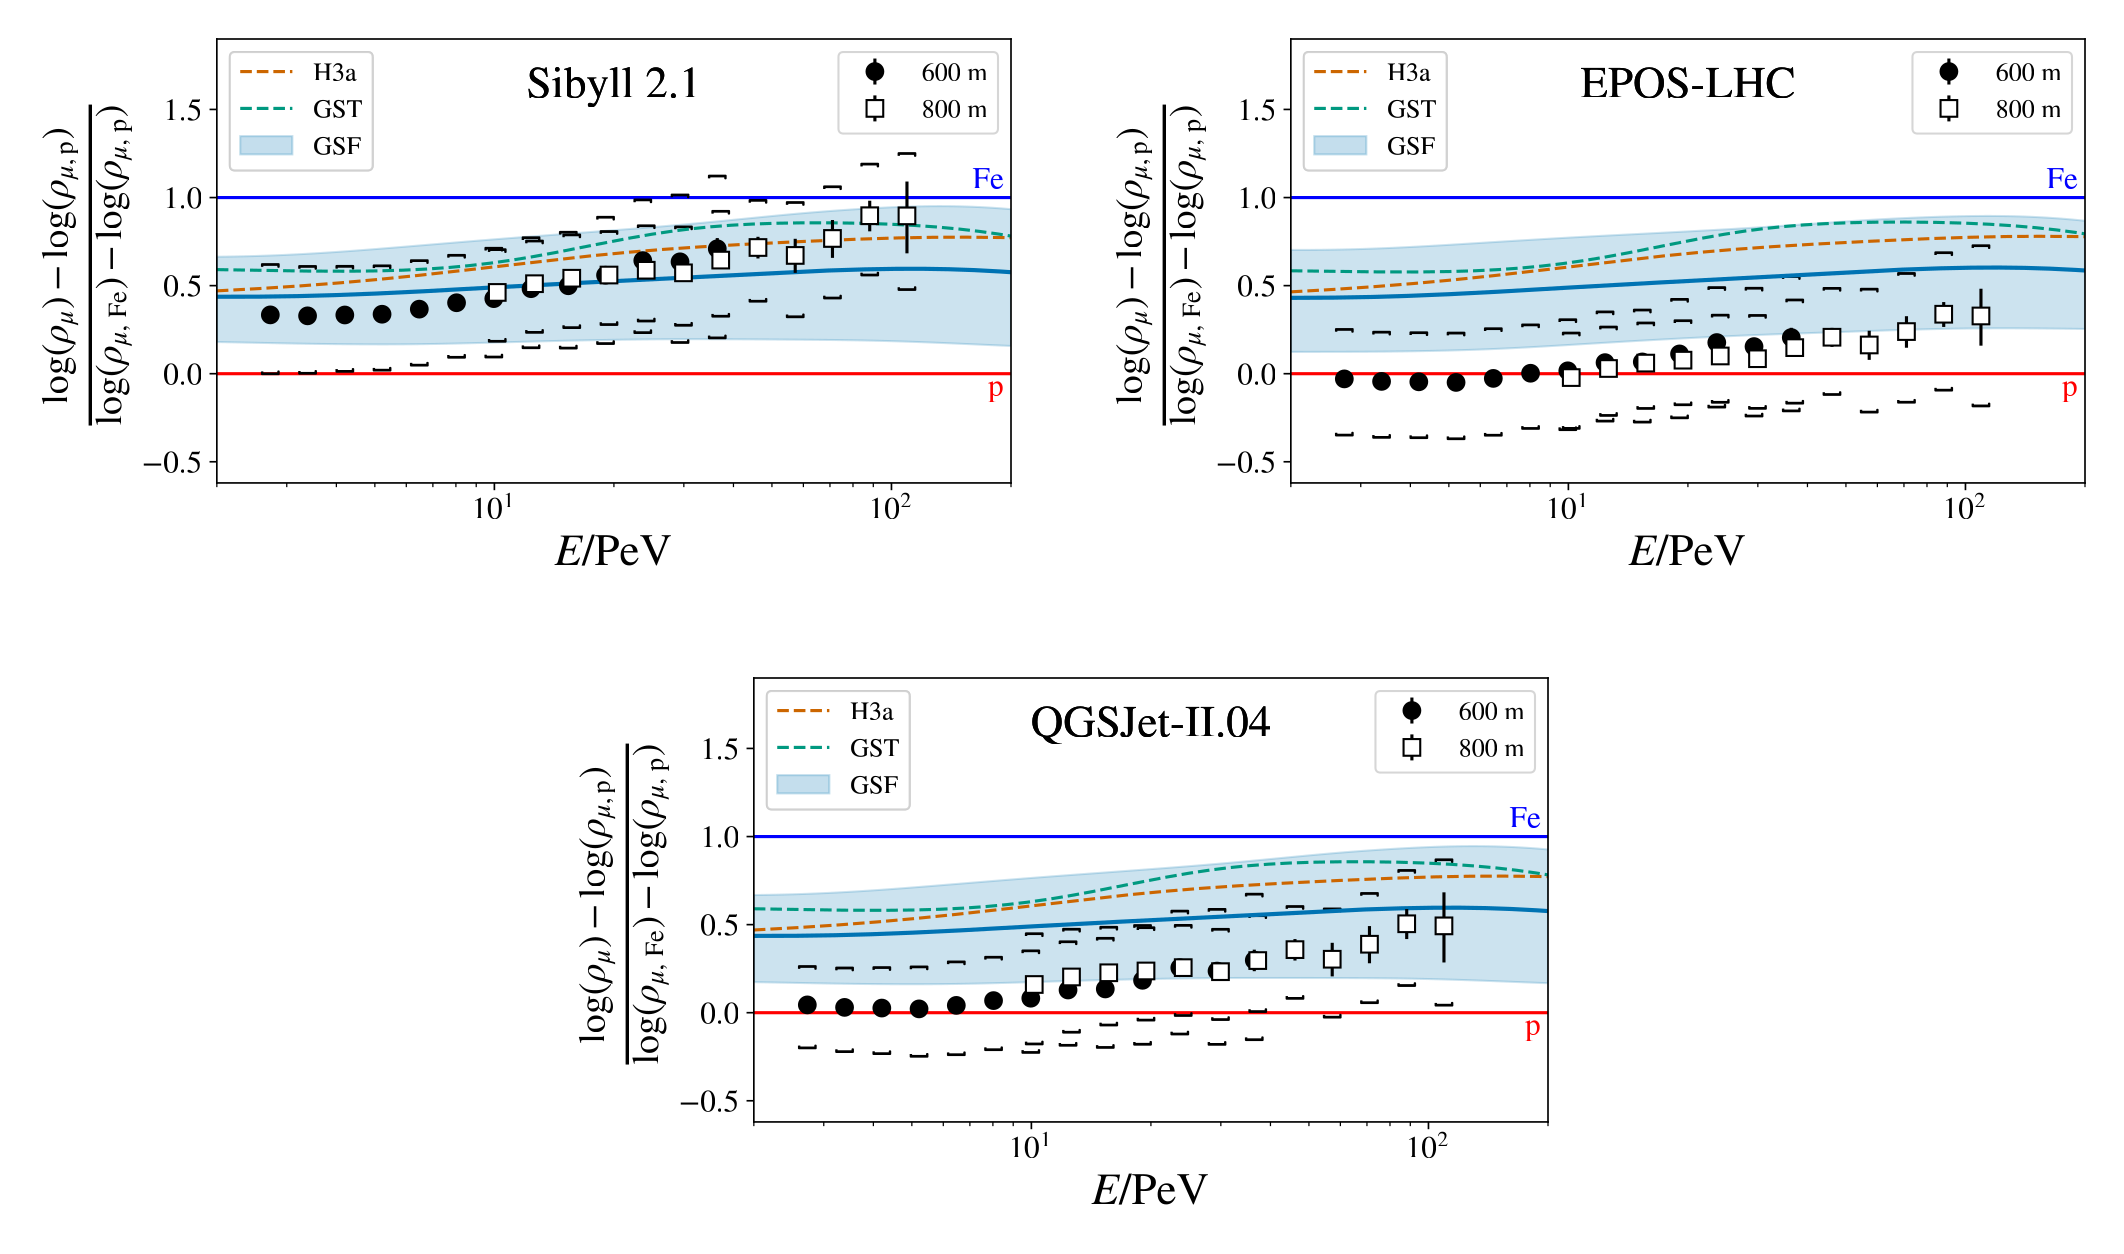
The result is summarized in the two figures below.
What happened since
August 2026. I left this work in 2018, when the paper above was still in review. Three things have happened since.
The analysis was published. It came out as Density of GeV muons in air showers measured with IceTop, Phys. Rev. D 106, 032010 (2022), arXiv:2201.12635: three years of IceTop data, muon densities from 200 to 1000 m lateral distance, covering 2.5–40 PeV at the 600 m reference distance and 9–120 PeV at 800 m. The measurement agrees with Sibyll 2.1 and is in tension with the post-LHC models QGSJet-II.04 and EPOS-LHC, which predict more muons than we see.
That deserves a clarification of the 2018 text above, which says simulations and data disagree without saying which way. It depends on the energy. Above roughly 100 PeV the data show a muon excess over models that grows with energy — the muon puzzle proper. At the PeV energies IceTop measures, the newer models instead overshoot. Both are failures of the same hadronic models, pointing in opposite directions in different regimes.
IceTop measured muons again, from the other end. In 2025 the collaboration counted high-energy muons, above 500 GeV, using showers seen simultaneously by IceTop at the surface and the in-ice array, over 2.5–100 PeV: Phys. Rev. D 112, 082004 (2025), arXiv:2506.19241. On its own the mean muon count agrees with every model tested. The interesting part is the combination: EPOS-LHC cannot describe the low-energy muon density and the high-energy muon count at the same time, while Sibyll 2.1 can. The measurement above became one half of a two-sided constraint that is harder to evade than either half alone.
The puzzle is not solved, but it is better diagnosed. The WHISP working group now pools muon measurements from eight experiments — EAS-MSU, IceCube, KASCADE-Grande, NEVOD-DECOR, Auger, SUGAR, Telescope Array and Yakutsk — on the same proton-to-iron scale used in the second figure above. Their combined picture: below about 100 PeV the data sit between the proton and iron predictions with no clear anomaly; above that, an excess that grows with energy. Models retuned after early LHC data agree better with each other but still fail to describe air shower data consistently, and QGSJET-III, built on newer LHC measurements, narrows the gap without closing it.
The favoured direction for a fix is to reduce the energy handed from the hadronic cascade to the electromagnetic one by suppressing neutral pion production or decay — in practice, enhanced production of strange particles in the forward direction — while staying consistent with the observed depth of shower maximum. That is now an active program: EPOS.LHC-R is subtitled "a global approach to solve the muon puzzle," and the proposed Forward Physics Facility at the LHC is partly justified by measuring this forward production directly.
- Albrecht et al., The Muon Puzzle in cosmic-ray induced air showers and its connection to the Large Hadron Collider — the standard review.